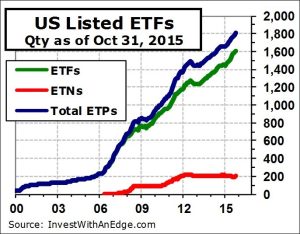
Twenty-six new ETFs and ETNs came to market in October, and eight closed. The quantity of products surpassed 1,800 for the first time, and the month-end count stood at 1,805 (1,604 ETFs and 201 ETNs). Assets surged 7.4% on excellent market gains, although inflows played a role, too. However, the big surprise of October was the decision by UBS to convert its entire lineup of 38 ETRACS Series A ETNs to closed-end funds.
 On October 8, UBS announced the launch of six new Series B ETNs, while simultaneously halting the issuance of any new notes on its existing 38 ETRACS ETNs. As any fan of ETFs and ETNs knows, it is the creation and redemption mechanism of these products that sets them apart from mutual funds, closed-end funds, and all other pooled investment vehicles. Share creation and redemption is the soul of an ETF. It is what forces the trading price to be aligned with the net asset value. Without a functioning creation and redemption mechanism, ETFs and ETNs are broken products – they essentially become closed-end funds.
At the end of September, UBS was the #2 issuer of ETNs for US markets.
Its $3.8 billion of ETN assets represented a 17.2% market share for ETRACS, second only to the 19.0% market share of the iPath brand. By deciding to halt all new issuance, UBS has effectively neutered its product lineup.
UBS issued an eight-page press release trying to explain what it was doing. Any press release that requires eight pages always gets my attention. This one was special, because even with eight pages it failed to provide any explanation or reasoning. Instead, it just raised more questions. I have been in contact with UBS on this matter since October 13 in an attempt to understand why this was done and how it benefits ETN owners. The firm’s only response has been “we’ll get back to you” on this. It’s now been nearly four weeks.
I recommend that investors avoid all 38 of the previously issued ETRACS Series A ETNs. They are now broken products, and UBS refuses to answer any questions about them. Another problem is that unsuspecting investors might buy one of these ETNs and not be aware that they are broken products. I fault the regulators and exchanges for this second problem. Potential buyers need to be fully warned when any ETF or ETN they are purchasing has a non-functioning creation and redemption mechanism.
Industry assets in the US jumped 7.4% to $2.12 trillion in October. The $146.7 billion increase was due to market gains of $117.1 billion and net inflows of $29.6 billion. While much media emphasis is placed on inflows, it was market action that accounted for about 80% of October’s increase.
Trading activity declined 9.0% for the month, with $1.69 trillion of ETFs and ETNs changing hands. Just twelve products averaged more than $1 billion per day in trading activity, yet this dozen grabbed a 55.9% market share. At the other extreme, 296 ETFs and ETNs (16.4%) went at least one day with zero volume. Fifteen funds went the entire month without seeing any action.
| October 2015 Month End | ETFs | ETNs | Total |
|---|---|---|---|
| Currently Listed U.S. | 1,604 | 201 | 1,805 |
| Listed as of 12/31/2014 | 1,451 | 211 | 1,662 |
| New Introductions for Month | 20 | 6 | 26 |
| Delistings/Closures for Month | 8 | 0 | 8 |
| Net Change for Month | +12 | +6 | +18 |
| New Introductions 6 Months | 154 | 9 | 163 |
| New Introductions YTD | 228 | 12 | 240 |
| Delistings/Closures YTD | 75 | 22 | 97 |
| Net Change YTD | +153 | -10 | +143 |
| Assets Under Mgmt ($ billion) | $2,097 | $23.6 | $2,120 |
| % Change in Assets for Month | +7.4% | +6.9% | +7.4% |
| % Change in Assets YTD | +6.3% | -12.2% | +6.1% |
| Qty AUM > $10 Billion | 52 | 0 | 52 |
| Qty AUM > $1 Billion | 249 | 6 | 255 |
| Qty AUM > $100 Million | 779 | 35 | 814 |
| % with AUM > $100 Million | 48.6% | 17.4% | 45.1% |
| Monthly $ Volume ($ billion) | $1,620 | $67.8 | $1,688 |
| % Change in Monthly $ Volume | -8.4% | -22.6% | -9.0% |
| Avg Daily $ Volume > $1 Billion | 11 | 1 | 12 |
| Avg Daily $ Volume > $100 Million | 89 | 5 | 94 |
| Avg Daily $ Volume > $10 Million | 313 | 11 | 324 |
| Actively Managed ETF Count (w/ change) | 133 | -1 mth | +8 ytd |
| Actively Managed AUM ($ billion) | $21.8 | +1.3% mth | +26.6% ytd |
Data sources: Daily prices and volume of individual ETPs from Norgate Premium Data. Fund counts and all other information compiled by Invest With An Edge.
New products launched in October (sorted by launch date):
- iShares Currency Hedged JPX-Nikkei 400 ETF (HJPX), launched 10/1/15, is a fund-of-funds ETF offering exposure to broad-based Japanese equities while mitigating against the changes in value between the Japanese yen and US dollar. It holds iShares JPX-Nikkei 400 ETF (JPXN) and then adds currency forwards to control the currency risk. The expense ratio is capped at 0.48% until 7/31/20 (HJPX overview).
- Guggenheim BulletShares 2023 High Yield Corporate Bond ETF (BSJN), launched 10/7/15, extends Guggenheim’s high yield bond ladder and will hold US dollar-denominated, below investment-grade corporate bonds maturing in the year 2023. The ETF sports a 0.42% expense ratio (BSJN overview).
- Guggenheim BulletShares 2025 Corporate Bond ETF (BSCP), launched 10/7/15, will invest in US dollar-denominated, investment-grade corporate bonds with effective maturities in the year 2025. BSCP’s expense ratio is 0.24% (BSCP overview).
- Financial Services Select Sector SPDR Fund (XLFS), launched 10/8/15, invests in securities of companies from financial industries such as diversified financial services, insurance, banks, consumer finance, and mortgage REITs. Each holding must be in the S&P 500 Index, and a modified market capitalization methodology is utilized to control single stock concentrations. Wells Fargo, Berkshire Hathaway, and JP Morgan Chase each have about a 10% allocation. Investors will pay 0.14% annually to own this ETF (XLFS overview).
- Real Estate Select Sector SPDR Fund (XLRE), launched 10/8/15, will hold equity positions in companies involved in real estate management and development as well as REITs. Each holding must be in the S&P 500 Index, and a single stock concentration will be controlled by using a modified market capitalization methodology. The ETF has 25 holdings, with Simon Properties the largest at 12.5%. The ETF’s expense ratio is 0.14% (XLRE overview).
- ETRACS 2xLeveraged Long Wells Fargo Business Development Company Index Series B ETN (LBDC), launched 10/9/15, is an exchange-traded note designed to provide investors two times leveraged exposure (200%) to the performance of the Wells Fargo Business Development Company Index, with the leverage reset monthly. The underlying index reflects the results of NYSE- and NASDAQ-listed business development companies that have at least $100 million in market capitalization. The ETN may or may not pay quarterly coupons, as they will be based on distributions of the index constituents less investor fees. LBDC is a clone of ETRACS 2xLeveraged Long Wells Fargo Business Development Company Index ETN (BDLC), an ETN released in 2011 that is no longer issuing new notes. The index has 44 constituents, but the top four represent about 40% of the ETN. LBDC has a 0.85% expense ratio (LBDC overview).
- ETRACS Alerian MLP Index Series B ETN (AMUB), launched 10/9/15, is an exchange-traded note linked to the performance of the Alerian MLP Index, which is a composite of 50 publicly traded Master Limited Partnerships in the energy sector. The ETN expects to pay a quarterly coupon linked to the cash distributions of the underlying constituents. Holdings, description, and maturity date match an earlier-released ETRACS Alerian MLP ETN (AMU), for which issuance was suspended on October 8. Just two positions represent nearly 29% of the index, Enterprise Products Partners LP at 18.1% and Energy Transfer Partners LP at 10.8%. The ETN sports a 0.80% expense ratio (AMUB overview).
- ETRACS Alerian MLP Infrastructure Index Series B ETN (MLPB), launched 10/9/15, is an exchange-traded note linked to the performance of an index comprised of 22 infrastructure Master Limited Partnerships in the energy sector that earn most of their revenue from the transportation and storage of energy commodities. The ETN plans to pay quarterly coupons based on the distributions of the index constituents. MLPB is a clone of ETRACS Alerian MLP Infrastructure Index ETN (MLPI), an ETN released in 2010 that is no longer issuing new notes. The expense ratio is 0.85% (MLPB overview).
- ETRACS Monthly Pay 2xLeveraged Mortgage REIT Series B ETN (MRRL), launched 10/9/15, is an exchange-traded note designed to provide investors two times leveraged exposure (200%) to the performance of an index comprised of 23 publicly traded mortgage REITs, with the leverage reset monthly. The ETN expects to dispense quarterly coupons based on two times the distributions of the index constituents. Holdings, description, and maturity date are identical to the three-year-old ETRACS Monthly Pay 2xLeveraged Mortgage REIT ETN (MORL), for which issuance was suspended on October 8. Investors will pay 0.40% annually to own this ETN (MRRL overview).
- ETRACS UBS Bloomberg Constant Maturity Commodity Index CMCI Total Return Series B ETN (UCIB), launched 10/9/15, is an exchange-traded note linked to the performance of an index comprised of 28 commodity futures contracts among the following five sectors: energy, precious and industrial metals, agricultural, and livestock. The contracts are structured across multiple maturities from three months to three years. UCIB is a clone of ETRACS CMCI Total Return ETN (UCI), an ETN released in 2008 that is no longer issuing new notes. The ETN has an expense ratio of 0.55% (UCIB overview).
- ETRACS Wells Fargo Business Development Company Index Series B ETN (BDCZ), launched 10/9/15, is an exchange-traded note designed to provide investors returns based on the Wells Fargo Business Development Company Index. The underlying index reflects the results of NYSE- and NASDAQ-listed business development companies that have at least $100 million in market capitalization. The ETN may or may not pay quarterly coupons, as they will be based on distributions of the index constituents less investor fees. Holdings, description, and maturity date are identical to the four-year-old ETRACS Wells Fargo Business Development Company Index ETN (BDCS), for which issuance was suspended on October 8. The ETN sport an expense ratio of 0.85% (BDCZ overview).
- PowerShares Developed EuroPacific Currency Hedged Low Volatility Portfolio (FXEP), launched 10/9/15, will invest in large- and mid-capitalization common stocks of companies located in developed market countries throughout Europe and Asia Pacific (excluding South Korea). The stocks selected are the 200 least volatile stocks in the S&P EPAC ex-Korea LargeMidCap Index. Holdings are weighted relative to the inverse of their volatility, so the less volatile the stock, the higher its weighting. Currency forwards are used to mitigate the changes in value between the US dollar and underlying currencies. The expense ratio is 0.25% (FXEP overview).
- PowerShares DWA Tactical Sector Rotation Portfolio (DWTR), launched 10/9/15, is a fund-of-funds designed to give investors exposure to the strongest US sectors through a universe of PowerShares sector ETFs. Nine broad sectors and cash are analyzed for their relative strength, and the four strongest are held in the portfolio. The sectors and positions are evaluated monthly for potential rebalance and reconstitution. The current PowerShares DWA holdings are Consumer Staples Momentum Portfolio (PSL) 27.4%, Consumer Cyclicals Momentum Portfolio (PEZ) 25.8%, Healthcare Momentum Portfolio (PTH) 25.4%, and Technology Momentum Portfolio (PTF) 21.4%. Investors will pay 0.75% annually to own this ETF (DWTR overview).
- PowerShares Japan Currency Hedged Low Volatility Portfolio (FXJP), launched 10/1/15, invests in the 100 least volatile stocks in the S&P Japan 500 Index. Holdings are weighted based on the inverse of their volatility, so the least volatile stocks get the highest weightings. Currency forwards are purchased to hedge against relative value changes between the US dollar and Japanese yen. The ETF has an expense ratio 0.25% (FXJP overview).
- PowerShares S&P 500 Momentum Portfolio (SPMO), launched 10/9/15, invests in about 100 stocks from the S&P 500 Index that have the highest momentum scores. Each security in the S&P 500 is scored by evaluating the percentage change in the stock’s price over a specified time and then applying an adjustment based on the security’s volatility. The 100 securities with the highest scores are weighted by multiplying their market capitalization and momentum score. Large-cap Growth is by far the largest style, with a dominating weighting of nearly 59%. SPMO sports an expense ratio of 0.25% (SPMO overview).
- PowerShares S&P 500 Value Portfolio (SPVU), launched 10/9/15, purchases up to 100 stocks from the S&P 500 Index that have the highest value scores based on three fundamental ratios. The ratios used are book value-to-price, earnings-to-price, and sales-to-price. The 100 securities with the highest scores are weighted by multiplying their value score and market capitalization. Financials is the largest sector at 41.2%, and Energy is the next in line at 20.0%. The expense ratio is 0.25% (SPVU overview).
- Loncar Cancer Immunotherapy ETF (CNCR), launched 10/14/15, holds a basket of global companies that develop therapies to fight cancer using the body’s own immune system. The 31 equities come from both large pharmaceutical and growth-oriented biotechnology companies and are equally-weighted. Investors will pay 0.79% annually to own this ETF (CNCR overview).
- CSOP China CSI 300 A-H Dynamic ETF (HAHA), launched 10/20/15, is designed to add value for investors by capitalizing on price differences between China A- and H-shares. The ETF starts with the 300 largest A-share Chinese equities. For those companies that are dual-listed, the ETF’s strategy switches between the different share classes to hold the one that is more attractively valued based on a proprietary formula, allowing the ETF to capture potential opportunities brought about by price discrepancies. HAHA has an expense ratio of 0.75% (HAHA overview).
- CSOP MSCI China A International Hedged ETF (CNHX), launched 10/20/15, aims to invest in the majority of the investible domestic Chinese equity universe. It holds 338 large-cap and mid-cap Chinese securities listed on the Shanghai and Shenzhen Stock Exchanges. CNHX then mitigates exposure to the fluctuations of the renminbi relative to the US dollar by entering into forward currency contracts or listed futures contract. The ETF sports a 0.79% expense ratio (CNHX overview).
- Deutsche X-trackers CSI 300 China A-Shares Hedged Equity ETF (ASHX), launched 10/20/15, is a fund-of-funds aiming to provide direct access to China A-share equities while mitigating exposure to fluctuations between the value of the Chinese renminbi and the US dollar. The ETF holds Deutsche X-trackers Harvest CSI 300 China A-Shares ETF (ASHR) along with currency forwards to neutralize changes between the US and Chinese currencies. The expense ratio will be capped at 0.85% for about three years until 10/1/18 (ASHX overview).
- SPDR S&P 500 High Dividend ETF (SPYD), launched 10/22/15, invests in the 80 equities in the S&P 500 that have the highest dividend yields. SPYD is currently indicating a yield of 4.0%. Investors will pay 0.12% annually to own this ETF (SPYD overview).
- The Restaurant ETF (BITE), launched 10/28/15, will hold US-listed companies that operate branded restaurants such as Starbucks, Chipotle, Buffalo Wild Wings, and Ruth’s Chris. The ETF will equally weight all restaurant companies that are publicly traded with at least $200 million in market capitalization and more than $1 million of daily trading. BITE claims to be first restaurant ETF, and it is the first ETF with “The” in its name. Its expense ratio is 0.75% (BITE overview).
- SPDR MSCI China A Shares IMI ETF (XINA), launched 10/29/15, will hold all size capitalization equities and attempts to include 99% of the investible Chinese domestic A-Share market. It has 500 positions, with two sectors over 20%: Financials 24.9% and Industrials 23.0%. The other end of the sector spectrum is Telecommunications at just 0.7%. XINA has an expense ratio of 0.65% (XINA overview).
- WisdomTree Europe Local Recovery Fund (EZR), launched 10/29/15, invests in European companies that derive more than 50% of their revenue from Europe and that are expected to benefit from the continent’s economic recovery and increases in buying power of its residents. It utilizes a weighting process designed to give more weight to companies that have higher correlations in performance to an indicator tied to the economic strength of Europe. France and Germany lead the country allocations at 26.5% and 24.7%, respectively. The expense ratio is capped at 0.48% until 10/31/17 (EZR overview).
- WisdomTree Global ex-U.S. Hedged Real Estate Fund (HDRW), launched 10/29/15, invests in non-US, dividend-paying Real Estate companies in developed and emerging markets and then hedges exposure to changes between the US dollar and foreign currencies. Companies must have a market capitalization of at least $1 billion, and holdings are weighted based on dividends. Current yield is listed at 4.2%. The expense ratio is capped at 0.43% until 7/31/15 (HDRW overview).
- WisdomTree Strong Dollar Emerging Markets Equity Fund (EMSD), launched 10/29/15, holds equities of emerging market companies that earn at least 15% of their revenue from US sources. The ETF emphasizes exposure to companies that may benefit from a strengthening US dollar. Taiwan and South Korea hold about 70% of the country allocations, with each at about 35%. The ETF sports an expense ratio of 0.58% (EMSD overview).
Product closures/delistings in October:
- AdvisorShares Pring Turner Business Cycle (DBIZ)
- Global X Brazil Financials (BRAF)
- Global X Central Asia & Mongolia Index ETF (AZIA)
- Global X Guru Small Cap Index ETF (GURX)
- Global X Junior Miners (JUNR)
- Direxion Daily 7-10 Year Treasury Bull 2x (SYTL)
- Direxion Daily Basic Materials Bull 3x (MATL)
- Direxion Daily Mid Cap Bull 2x (MDLL)
Note: EGShares Blue Chip ETF (BCHP) and EGShares Brazil Infrastructure (BRXX) had their last day of listed trading on October 30. However, since they were still officially listed at the end of the month, their assets are included in the October statistics and their closures will be included in the November statistics.
Product changes in October:
- Direxion performed reverse splits on six of its leveraged ETFs effective October 1.
- Market Vectors Emerging Markets Local Currency Bond ETF (EMLC) was renamed Market Vectors JPMorgan EM Local Currency Bond ETF (EMLC) effective October 1.
- UBS halted creation & note issuance on all 38 of its ETRACS Series A ETNs effective October 8.
- Owners of AccuShares Spot CBOE VIX Up (VXUP) received a “corrective distribution” of one share of AccuShares Spot CBOE VIX Down (VXDN) for each share held effective October 16. Meanwhile, the owners of AccuShares Spot CBOE VIX Down (VXDN) received a “corrective distribution” of one share of AccuShares Spot CBOE VIX Up (VXUP) plus a regular distribution of $3.711736. This was also done in September.
- Both AccuShares Spot CBOE VIX Up (VXUP) and AccuShares Spot CBOE VIX Down (VXDN) had 1-for-10 reverse splits effective October 23.
- The Merck Gold Trust (OUNZ) became the Van Eck Merck Gold Trust (OUNZ) effective October 26. The rebranded ETF still allows retail investors to take physical delivery of their gold.
- The iShares Currency Hedged Global ex USD High Yield Bond ETF (HHYX) was renamed the iShares Currency Hedged International High Yield Bond ETF (HHYX) effective October 30.
Announced Product Changes for Coming Months:
- AdvisorShares Sunrise Global Multi-Strategy WTF (MULT) will undergo an extreme makeover, becoming the AdvisorShares Market Adaptive Unconstrained Income ETF (MAUI) with a new manager and subadvisor effective November 4.
- ProShares 3x Leveraged and Inverse Financial Sector ETFs (FINU and FINZ) will change to S&P Select Sector Indexes effective November 4.
- Van Eck Global plans to acquire Yorkville MLP ETFs (press release) and hopes to close the transaction in the fourth quarter.
Previous monthly ETF statistics reports are available here.
Disclosure covering writer: No positions in any of the securities mentioned. No positions in any of the companies or ETF sponsors mentioned. No income, revenue, or other compensation (either directly or indirectly) received from, or on behalf of, any of the companies or ETF sponsors mentioned.