UBS launched ETRACS Fisher-Gartman Risk On ETN (ONN) and ETRACS Fisher-Gartman Risk Off ETN (OFF) on November 30, 2011. The new exchange-traded notes (“ETNs”) are described as comprehensive “risk on” and “risk off” trading vehicles based on the newly invented Fisher-Gartman Risk Index.
The underlying index provides 150% long and 50% short exposure to static asset classes whose allocations potentially increase in value when the market/economic outlook is positive and decrease when the outlook is negative. The base index allocations are:
- 76% long and 0% short Commodity Futures
- 46% long and 0% short Equity ETPs
- 28% long and 16% short Currency Futures
- 0% long and 34% short Sovereign Bond Futures
ONN will track the index (150% long and 50% short) minus a 0.85% tracking fee and a 1% annual distribution. The distribution is intended to meet or exceed the expected dividend yield from the underlying equity exchange-traded products (“ETPs”). Since ONN is a trading vehicle rather than a buy-and-hold instrument, the simulated dividend appears to have little value.
OFF will track the inverse of the index, effectively providing a 150% short and 50% long exposure (opposite from the table above), minus a 1.15% tracking fee. The index is rebalanced quarterly, and the leverage factors are effectively reset at that time.
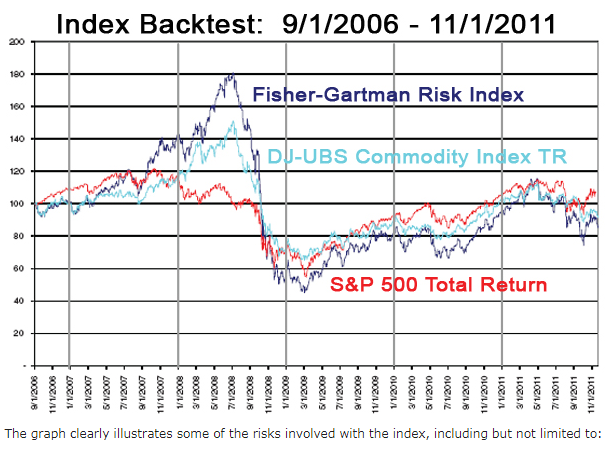
Although the index just began on November 4, UBS was kind enough to provide the results of the approximately 5-year back test as part of the prospectus (pdf).

The graph clearly illustrates some of the risks involved with the index, including but not limited to:
- Underperforming both stocks and commodities prior to ETN fees being removed
- A 75% decline from mid-2008 to early 2009
- Remaining more than 50% below its former peak
- More volatility than either stocks or commodities
However, I believe the graph omits one of the most significant risks – the risk that the index may not perform as expected in the future. The index composition appears highly optimized for market conditions during the backtest period. Furthermore, there is no provision allowing the basic index composition to change over time.
This index would clearly have not represented the “risk on” asset classes of the late 1990s. During that period, the “risk on” trade consisted of being long large cap growth stocks and short commodities. In the early 2000s, small cap value stocks took the lead. Likewise, the “risk on” and “risk off” trades in 2014 (or perhaps sooner) will likely involve different asset classes than those used by the Fisher-Gartman Risk Index.
UBS provides extensive background materials, and I advise all potential investors to study them prior to purchase. The methodology of the Fisher-Gartman Risk Index is available at the index sponsor’s website, http://www.mbfih.com/. Additional details on the underlying futures contracts, ETFs, and ETNs that comprise the index are available in the ONN overview and OFF overview as well as the ONN fact sheet (pdf) and OFF fact sheet (pdf).
Disclosure covering writer, editor, and publisher: No positions in any of the securities mentioned. No positions in any of the companies or ETF sponsors mentioned. No income, revenue, or other compensation (either directly or indirectly) received from, or on behalf of, any of the companies or ETF sponsors mentioned.