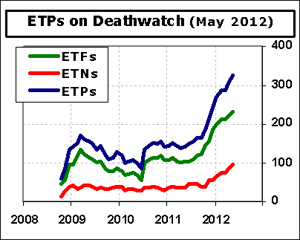
 The quantity of products on ETF Deathwatch climbs again with twenty names being added to the list for May and only four coming off. The net increase of 16 pushes the total count to 324, consisting of 229 ETFs and 95 ETNs. Another 138 products were excluded because they are less than six months old, making them too new for consideration. Therefore, the current list of 324 is from an eligible universe of only 1,319 ETFs and ETNs. In other words, nearly a quarter (24.6%) of the products that have attained six months of age are on ETF Deathwatch.
 On the last day of April, 183 listed products traded a grand total of zero shares for the day. Eight of them went the entire month without any trading action. One of the most important aspects of ETFs is their ability to create and redeem shares through in-kind exchanges. This is what makes them unique and prevents the formation of discounts and premiums. However, the creation/redemption process requires volume, typically involving 50,000 shares of the ETF. For the ETFs on Deathwatch, it takes weeks or months to generate that much volume. For them, the creation/redemption process is virtually non-existent, destroying the ability to arbitrage the price to the net asset value.
The NASDAQ recently proposed a rule change known as the Market Quality Program, which would allow ETF issuers to pay market makers to maintain better bid/ask spreads on these securities. In footnote 39 of the NASDAQ proposal (pdf), the NASDAQ references my comments from ETF Deathwatch for March 2012 about the lack of attention market makers give these products. However, I believe it will take much more than better bid/ask spread management to breathe life into many of these funds.
The average product on the list is 25.4 months old and has just $6.4 million in assets. Looking only at ETFs, the percentage on Deathwatch is 20.4% (229 of 1123 eligible). For ETNs, the percentage jumps to 48.5% (95 of 196 eligible). Within the actively managed ETF grouping, there is also disproportionate representation with 43.6% (17 of 39 eligible) on Deathwatch.
The 20 ETPs added to Deathwatch for May:
- CurrencyShares Chinese Renminbi Trust (FXCH)
- iPath Inverse S&P 500 VIX S-T Futures ETN II (IVOP)
- iPath Short Enhanced -2x MSCI Emerging Markets ETN (EMSA)
- Market Vectors Gulf States (MES)
- PowerShares S&P International Developed High Quality (IDHQ)
- ProShares Short KBW Regional Banking (KRS)
- ProShares Ultra Consumer Goods (UGE)
- ProShares UltraShort Russell 2000 Value (SJH)
- RBS Global Big Pharma ETN (DRGS)
- Russell Small Cap Aggressive Growth ETF (SGGG)
- Russell Small Cap Consistent Growth ETF (SCOG)
- Russell Small Cap Contrarian ETF (SCTR)
- Russell Small Cap Low P/E ETF (SCLP)
- UBS ETRACS Monthly 2x ISE Cloud Computing ETN (LSKY)
- VelocityShares 2x Inverse Palladium ETN (IPAL)
- VelocityShares 2x Inverse Platinum ETN (IPLT)
- VelocityShares 2x Long Palladium ETN (LPAL)
- VelocityShares 2x Long Platinum ETN (LPLT)
- VelocityShares 3x Inverse Gold ETN (DGLD)
- WisdomTree Dreyfus South African Rand (SZR)
The 4 ETPs removed from Deathwatch for May:
- ESG Shares Pax MSCI EAFE ESG Index ETF (EAPS)
- Focus Morningstar Technology Index ETF (FTQ)
- iPath US Treasury Steepener ETN (STPP)
- iShares S&P Target Date 2020 Index Fund (TZG)
The ETF Deathwatch criteria produced the following list of 324 ETPs for April:
ETF DEATHWATCH FOR MAY 2012
| # | Ticker Sym | ETF Name | Age (mths) | AUM (millions) | 3-mth Avg Daily $ Volume |
|---|---|---|---|---|---|
| 1 | DENT | AdvisorShares Dent Tactical ETF | 32 | $6.7 | $41,187 |
| 2 | FWDD | AdvisorShares Madrona Domestic ETF | 10 | $16.0 | $91,904 |
| 3 | FWDB | AdvisorShares Madrona Global Bond ETF | 10 | $17.3 | $65,481 |
| 4 | FWDI | AdvisorShares Madrona International ETF | 10 | $13.0 | $34,440 |
| 5 | MATH | AdvisorShares Meidell Tactical Advantage ETF | 10 | $6.0 | $91,841 |
| 6 | AADR | AdvisorShares WCM/BNY Mellon Foc Gr ADR | 22 | $6.8 | $29,603 |
| 7 | BXDB | Barclays ETN+ S&P 500 1x Short B 2009 ETN | 30 | $4.6 | $14,500 |
| 8 | ADRU | BLDRS Europe 100 ADR | 115 | $13.6 | $42,008 |
| 9 | GCE | Claymore CEF Index GS Connect ETN | 53 | $3.4 | $93,238 |
| 10 | GVT | Columbia Concentrated Large Cap Value Strat | 36 | $3.0 | $8,539 |
| 11 | GMTB | Columbia Core Bond Strategy Fund | 27 | $5.3 | $14,698 |
| 12 | RPX | Columbia Growth Equity Strategy Fund | 31 | $1.5 | $17,598 |
| 13 | GMMB | Columbia Intermediate Municipal Bond Strategy | 27 | $5.9 | $37,766 |
| 14 | RWG | Columbia Large-Cap Growth Equity | 31 | $7.9 | $31,897 |
| 15 | CSMN | Credit Suisse Market Neutral Glb Equity ETN | 7 | $15.6 | $53,608 |
| 16 | CSMB | Credit Suisse Merger Arb Liquid 2x Mth ETN | 14 | $23.4 | $65,975 |
| 17 | FXCH | CurrencyShares Chinese Renminbi Trust | 7 | $8.0 | $21,918 |
| 18 | TDD | db-X 2010 Target Date Fund | 56 | $14.3 | $29,499 |
| 19 | TDX | db-X In-Target Date Fund | 56 | $10.0 | $20,381 |
| 20 | DBBR | db-X MSCI Brazil Currency-Hedged Equity | 11 | $4.5 | $25,228 |
| 21 | DBCN | db-X MSCI Canada Currency-Hedged Equity | 11 | $4.6 | $1,017 |
| 22 | DBEM | db-X MSCI Emerging Mkts Currency-Hdg Eqty | 11 | $4.6 | $58,292 |
| 23 | DBJP | db-X MSCI Japan Currency-Hedged Equity | 11 | $4.9 | $115,155 |
| 24 | TYBS | Direxion Daily 20+ Year Treasury Bear 1x | 13 | $2.9 | $10,161 |
| 25 | TYNS | Direxion Daily 7-10 Year Treasury Bear 1x | 13 | $3.4 | $11,140 |
| 26 | TYD | Direxion Daily 7-10 Year Treasury Bull 3x | 37 | $4.0 | $382,438 |
| 27 | COWS | Direxion Daily Agribusiness Bear 3x | 11 | $2.1 | $94,586 |
| 28 | COWL | Direxion Daily Agribusiness Bull 3x | 11 | $2.9 | $175,512 |
| 29 | MATS | Direxion Daily Basic Materials Bear 3x | 11 | $1.2 | $74,545 |
| 30 | BRIS | Direxion Daily BRIC Bear 3x | 26 | $2.2 | $62,364 |
| 31 | SICK | Direxion Daily Healthcare Bear 3x | 11 | $2.4 | $27,291 |
| 32 | CURE | Direxion Daily Healthcare Bull 3x | 11 | $4.4 | $63,084 |
| 33 | INDZ | Direxion Daily India Bear 3x | 26 | $4.2 | $384,538 |
| 34 | GASX | Direxion Daily Natural Gas Related Bear 3x | 22 | $0.9 | $490,316 |
| 35 | RETS | Direxion Daily Retail Bear 3x | 22 | $2.4 | $122,912 |
| 36 | SAGG | Direxion Daily Total Bond Market Bear 1x | 13 | $18.3 | $10,913 |
| 37 | TOTS | Direxion Daily Total Market Bear 1x | 11 | $3.3 | $11,159 |
| 38 | LGEM | EGShares Basic Materials GEMS ETF | 10 | $2.3 | $37,152 |
| 39 | GGEM | EGShares Consumer Goods GEMS ETF | 10 | $1.1 | $53,486 |
| 40 | VGEM | EGShares Consumer Services GEMS ETF | 10 | $1.0 | $33,088 |
| 41 | FGEM | EGShares Financials GEMS ETF | 32 | $3.0 | $17,489 |
| 42 | HGEM | EGShares Health Care GEMS ETF | 10 | $1.9 | $4,302 |
| 43 | INCO | EGShares India Consumer ETF | 9 | $1.9 | $83,668 |
| 44 | IGEM | EGShares Industrials GEMS ETF | 10 | $1.8 | $47,776 |
| 45 | QGEM | EGShares Technology GEMS ETF | 10 | $1.8 | $18,239 |
| 46 | TGEM | EGShares Telecom GEMS ETF | 10 | $4.1 | $69,026 |
| 47 | UGEM | EGShares Utilities GEMS ETF | 10 | $2.8 | $88,592 |
| 48 | GWO | ELEMENTS CS Global Warming ETN | 50 | $2.7 | $9,262 |
| 49 | FUE | ELEMENTS MLCX Biofuels ETN | 51 | $2.3 | $8,423 |
| 50 | WMW | ELEMENTS Morningstar Wide Moat Focus ETN | 55 | $15.4 | $127,183 |
| 51 | EEH | ELEMENTS Spctrm LgCap US Sector Mo ETN | 58 | $1.1 | $2,193 |
| 52 | FOL | FactorShares 2X: Oil Bull/S&P500 Bear | 14 | $1.7 | $61,461 |
| 53 | FSE | FactorShares 2X: S&P500 Bull/TBond Bear | 14 | $1.3 | $16,770 |
| 54 | FSU | FactorShares 2X: S&P500 Bull/USD Bear | 14 | $2.3 | $2,229 |
| 55 | FSA | FactorShares 2X: TBond Bull/S&P500 Bear | 14 | $2.2 | $5,665 |
| 56 | FPA | First Trust Asia Pacific Ex-Japan AlphaDEX | 13 | $2.5 | $55,713 |
| 57 | FBZ | First Trust Brazil AlphaDEX Fund | 13 | $7.9 | $133,841 |
| 58 | FCA | First Trust China AlphaDEX Fund | 13 | $3.3 | $77,666 |
| 59 | FEP | First Trust Europe AlphaDEX Fund | 13 | $3.6 | $80,431 |
| 60 | FJP | First Trust Japan AlphaDEX | 13 | $3.8 | $135,003 |
| 61 | FLN | First Trust Latin America AlphaDEX | 13 | $4.1 | $56,003 |
| 62 | FMK | First Trust Mega Cap AlphaDEX Fund | 12 | $10.7 | $184,636 |
| 63 | FNK | First Trust Mid Cap Value AlphaDEX | 13 | $8.4 | $56,655 |
| 64 | FONE | First Trust NASDAQ CEA Smartphone | 15 | $13.8 | $83,315 |
| 65 | QCLN | First Trust Nasdaq Clean Edge Green Energy | 63 | $18.7 | $45,712 |
| 66 | GRID | First Trust Nasdaq Clean Edge Smart Grid | 30 | $13.5 | $35,656 |
| 67 | CARZ | First Trust NASDAQ Global Auto Index | 12 | $5.5 | $118,156 |
| 68 | FYC | First Trust Small Cap Growth AlphaDEX | 13 | $8.5 | $83,944 |
| 69 | FYT | First Trust Small Cap Value AlphaDEX | 13 | $4.2 | $66,685 |
| 70 | FKO | First Trust South Korea AlphaDEX | 13 | $1.2 | $76,072 |
| 71 | FVI | First Trust Value Line Equity Allocation | 66 | $6.8 | $27,546 |
| 72 | FBM | Focus Morningstar Basic Materials Index ETF | 13 | $4.4 | $60,368 |
| 73 | FCQ | Focus Morningstar Communication Srvcs ETF | 13 | $5.2 | $23,121 |
| 74 | FCL | Focus Morningstar Consumer Cyclical ETF | 13 | $2.9 | $49,274 |
| 75 | FCD | Focus Morningstar Consumer Defensive ETF | 13 | $5.8 | $31,890 |
| 76 | FEG | Focus Morningstar Energy Index ETF | 13 | $5.8 | $230,413 |
| 77 | FFL | Focus Morningstar Financial Services ETF | 13 | $4.8 | $69,919 |
| 78 | FHC | Focus Morningstar Health Care Index ETF | 13 | $5.8 | $43,767 |
| 79 | FIL | Focus Morningstar Industrials Index ETF | 13 | $5.0 | $24,293 |
| 80 | FLG | Focus Morningstar Large Cap Index ETF | 13 | $8.1 | $108,853 |
| 81 | FMM | Focus Morningstar Mid Cap Index ETF | 13 | $5.2 | $95,013 |
| 82 | FRL | Focus Morningstar Real Estate Index ETF | 13 | $5.6 | $58,698 |
| 83 | FOS | Focus Morningstar Small Cap Index ETF | 13 | $5.1 | $172,383 |
| 84 | FUI | Focus Morningstar Utilities Index ETF | 13 | $7.0 | $46,546 |
| 85 | ALUM | Global X Aluminum ETF | 16 | $2.5 | $29,826 |
| 86 | VROM | Global X Auto ETF | 12 | $4.9 | $98,108 |
| 87 | BRAF | Global X Brazil Financials ETF | 21 | $4.1 | $86,615 |
| 88 | CHIE | Global X China Energy ETF | 29 | $4.8 | $29,979 |
| 89 | CHII | Global X China Industrial ETF | 29 | $4.8 | $75,972 |
| 90 | CHIM | Global X China Materials ETF | 28 | $2.5 | $20,256 |
| 91 | AND | Global X FTSE Andean 40 ETF | 15 | $8.4 | $153,168 |
| 92 | ARGT | Global X FTSE Argentina 20 ETF | 14 | $3.3 | $53,900 |
| 93 | QQQC | Global X NASDAQ China Technology ETF | 29 | $4.6 | $18,521 |
| 94 | GGGG | Global X Pure Gold Miners ETF | 14 | $4.7 | $54,135 |
| 95 | TSXV | Global X S&P/TSX Venture 30 Canada ETF | 14 | $2.6 | $27,783 |
| 96 | ABCS | Guggenheim ABC High Dividend ETF | 11 | $13.4 | $184,104 |
| 97 | GIY | Guggenheim Enhanced Core Bond ETF | 51 | $5.2 | $91,314 |
| 98 | EWEF | Guggenheim MSCI EAFE Equal Weight ETF | 17 | $11.3 | $176,160 |
| 99 | EWMD | Guggenheim S&P MidCap 400 Equal Weight | 9 | $3.2 | $63,229 |
| 100 | EWSM | Guggenheim S&P SmallCap 600 Equal Weight | 9 | $6.3 | $23,742 |
| 101 | WXSP | Guggenheim Wilshire 4500 Completion ETF | 26 | $6.4 | $18,466 |
| 102 | WFVK | Guggenheim Wilshire 5000 Total Market ETF | 26 | $6.2 | $57,101 |
| 103 | WMCR | Guggenheim Wilshire Micro-Cap ETF | 68 | $16.2 | $30,000 |
| 104 | RMB | Guggenheim Yuan Bond ETF | 7 | $5.0 | $17,472 |
| 105 | PGD | iPath Asian & Gulf Currency Revaluation ETN | 47 | $4.1 | $19,516 |
| 106 | BWV | iPath CBOE S&P 500 BuyWrite Index ETN | 60 | $11.4 | $83,480 |
| 107 | JJU | iPath DJ-UBS Aluminum ETN | 47 | $3.9 | $203,894 |
| 108 | LD | iPath DJ-UBS Lead ETN | 47 | $1.8 | $45,400 |
| 109 | ERO | iPath EUR/USD Exchange Rate ETN | 61 | $4.9 | $24,875 |
| 110 | GBB | iPath GBP/USD Exchange Rate ETN | 61 | $2.7 | $44,008 |
| 111 | JEM | iPath GEMS Index ETN | 52 | $1.5 | $9,467 |
| 112 | GRN | iPath Global Carbon ETN | 47 | $1.1 | $9,679 |
| 113 | IVOP | iPath Inverse S&P 500 VIX S-T Futures ETN II | 7 | $4.8 | $33,348 |
| 114 | MFLA | iPath Long Enh 2x MSCI EAFE Index ETN | 17 | $2.8 | $0 |
| 115 | EMLB | iPath Long Enh 2x MSCI Emerging Mkts ETN | 17 | $3.3 | $5,027 |
| 116 | VZZB | iPath Long Enh 2x S&P 500 VIX M-T Fut ETN | 10 | $2.2 | $251,454 |
| 117 | ROLA | iPath Long Ext 3x Russell 1000 TR ETN | 17 | $6.7 | $5,939 |
| 118 | SFLA | iPath Long Ext 3x S&P 500 TR Index ETN | 17 | $8.4 | $34,235 |
| 119 | DIRT | iPath Pure Beta Agriculture ETN | 13 | $2.8 | $10,380 |
| 120 | FOIL | iPath Pure Beta Aluminum ETN | 13 | $1.7 | $459 |
| 121 | CHOC | iPath Pure Beta Cocoa ETN | 13 | $2.7 | $26,026 |
| 122 | CAFE | iPath Pure Beta Coffee ETN | 13 | $1.6 | $18,137 |
| 123 | CUPM | iPath Pure Beta Copper ETN | 13 | $2.6 | $41,024 |
| 124 | CTNN | iPath Pure Beta Cotton ETN | 13 | $1.8 | $6,977 |
| 125 | OLEM | iPath Pure Beta Crude Oil ETN | 13 | $22.4 | $457,031 |
| 126 | ONG | iPath Pure Beta Energy ETN | 13 | $2.2 | $523 |
| 127 | WEET | iPath Pure Beta Grains ETN | 13 | $2.3 | $88,362 |
| 128 | HEVY | iPath Pure Beta Industrial Metals ETN | 13 | $2.8 | $21,739 |
| 129 | LEDD | iPath Pure Beta Lead ETN | 13 | $1.1 | $11,828 |
| 130 | LSTK | iPath Pure Beta Livestock ETN | 13 | $1.2 | $23,467 |
| 131 | NINI | iPath Pure Beta Nickel ETN | 13 | $1.4 | $2,597 |
| 132 | BLNG | iPath Pure Beta Precious Metals ETN | 13 | $2.4 | $53,714 |
| 133 | SBV | iPath Pure Beta S&P GSCI-Weighted ETN | 13 | $1.4 | $1,173 |
| 134 | GRWN | iPath Pure Beta Softs ETN | 13 | $1.0 | $2,698 |
| 135 | SGAR | iPath Pure Beta Sugar ETN | 13 | $2.4 | $9,363 |
| 136 | DCNG | iPath Seasonal Natural Gas ETN | 13 | $2.1 | $6,680 |
| 137 | MFSA | iPath Short Enh -2x MSCI EAFE Index ETN | 17 | $5.1 | $2,240 |
| 138 | EMSA | iPath Short Enh -2x MSCI Emerging Mkts ETN | 17 | $6.1 | $1,921 |
| 139 | ROSA | iPath Short Ext -3x Russell 1000 TR ETN | 17 | $1.7 | $14,734 |
| 140 | DTYL | iPath US Treasury 10-year Yield Bull ETN | 21 | $8.3 | $195,314 |
| 141 | DTUS | iPath US Treasury 2-year Yield Bear ETN | 21 | $17.3 | $59,940 |
| 142 | DTUL | iPath US Treasury 2-year Yield Bull ETN | 21 | $4.1 | $3,420 |
| 143 | DFVS | iPath US Treasury 5-Year Yield Bear ETN | 10 | $1.2 | $7,580 |
| 144 | DFVL | iPath US Treasury 5-Year Yield Bull ETN | 10 | $1.8 | $367 |
| 145 | DLBL | iPath US Treasury Long Bond Yield Bull ETN | 21 | $4.8 | $159,915 |
| 146 | EMER | IQ Emerging Markets Mid Cap ETF | 10 | $1.7 | $17,211 |
| 147 | IOIL | IQ Global Oil Small Cap ETF | 12 | $2.6 | $141,741 |
| 148 | IFEU | iShares FTSE EPRA/NAREIT Europe | 54 | $12.4 | $104,501 |
| 149 | FNIO | iShares FTSE NAREIT Industrial/Office Cpd | 61 | $10.1 | $60,800 |
| 150 | AXDI | iShares MSCI ACWI ex US Consumer Discr | 22 | $6.3 | $29,811 |
| 151 | AXSL | iShares MSCI ACWI ex US Consumer Staples | 22 | $3.4 | $28,730 |
| 152 | AXEN | iShares MSCI ACWI ex US Energy | 22 | $5.7 | $90,987 |
| 153 | AXFN | iShares MSCI ACWI ex US Financials | 28 | $2.1 | $6,789 |
| 154 | AXHE | iShares MSCI ACWI ex US Health Care | 22 | $9.0 | $53,526 |
| 155 | AXID | iShares MSCI ACWI ex US Industrials | 22 | $2.7 | $30,374 |
| 156 | AXIT | iShares MSCI ACWI ex US Info Technology | 22 | $2.8 | $11,409 |
| 157 | AXMT | iShares MSCI ACWI ex US Materials | 22 | $2.7 | $15,993 |
| 158 | AXTE | iShares MSCI ACWI ex US Telecom Services | 22 | $2.7 | $12,903 |
| 159 | AXUT | iShares MSCI ACWI ex US Utilities | 22 | $6.5 | $219,549 |
| 160 | EMFN | iShares MSCI Emerging Markets Financials | 28 | $3.6 | $67,512 |
| 161 | EMMT | iShares MSCI Emerging Markets Materials | 28 | $8.3 | $72,601 |
| 162 | FEFN | iShares MSCI Far East Financials Sector | 28 | $2.4 | $1,770 |
| 163 | NUCL | iShares S&P Global Nuclear Energy | 47 | $11.6 | $32,979 |
| 164 | TZD | iShares S&P Target Date 2010 Index Fund | 42 | $4.9 | $15,648 |
| 165 | TZE | iShares S&P Target Date 2015 Index Fund | 42 | $11.8 | $103,567 |
| 166 | TZL | iShares S&P Target Date 2030 Index Fund | 42 | $14.0 | $65,257 |
| 167 | TZO | iShares S&P Target Date 2035 Index Fund | 42 | $10.5 | $53,020 |
| 168 | TZV | iShares S&P Target Date 2040 Index Fund | 42 | $19.6 | $85,622 |
| 169 | TZW | iShares S&P Target Date 2045 Index Fund | 9 | $4.1 | $12,660 |
| 170 | TZY | iShares S&P Target Date 2050 Index Fund | 9 | $4.1 | $37,927 |
| 171 | TGR | iShares S&P Target Date Retirement Inc. | 42 | $7.8 | $48,928 |
| 172 | DSXJ | JPM Qtrly Dbl Short US 10-Yr Treas Fut ETN | 19 | $8.1 | $20,453 |
| 173 | DSTJ | JPM Qtrly Dbl Short US Long Treas Fut ETN | 19 | $7.4 | $4,872 |
| 174 | JFT | KEYnotes FT Enhanced 130/30 Large Cap ETN | 48 | $3.6 | $4,746 |
| 175 | XMPT | Market Vectors CEF Municipal Income ETF | 10 | $8.4 | $103,510 |
| 176 | COLX | Market Vectors Colombia ETF | 14 | $2.0 | $12,961 |
| 177 | URR | Market Vectors Double Long Euro ETN | 48 | $0.9 | $11,510 |
| 178 | GERJ | Market Vectors Germany Small-Cap ETF | 13 | $3.1 | $17,149 |
| 179 | MES | Market Vectors Gulf States | 46 | $12.3 | $71,254 |
| 180 | INR | Market Vectors Indian Rupee/USD ETN | 50 | $2.7 | $14,246 |
| 181 | FLTR | Market Vectors Investment Grd Floating Rate | 12 | $7.2 | $47,274 |
| 182 | BONO | Market Vectors LatAm Aggregate Bond ETF | 12 | $7.6 | $54,587 |
| 183 | RSXJ | Market Vectors Russia Small-Cap ETF | 13 | $5.1 | $182,085 |
| 184 | MLPY | Morgan Stanley Cushing MLP High Income ETN | 14 | $19.7 | $44,303 |
| 185 | BARL | Morgan Stanley S&P 500 Crude Oil ETN | 10 | $12.2 | $11,312 |
| 186 | NASI | Pax MSCI North America ESG Index | 24 | $10.4 | $59,154 |
| 187 | TRSY | PIMCO Broad U.S. Treasury Index Fund | 18 | $19.1 | $12,767 |
| 188 | PLK | PowerShares Active Low Duration | 49 | $7.6 | $47,709 |
| 189 | PMA | PowerShares Active Mega-Cap Portfolio | 49 | $10.2 | $24,562 |
| 190 | CVRT | PowerShares Convertible Securities Portfolio | 11 | $9.5 | $97,249 |
| 191 | JGBT | PowerShares DB 3x Japanese G-Bond Fut ETN | 13 | $4.4 | $24,811 |
| 192 | UDNT | PowerShares DB 3x Short USD Idx Futures ETN | 11 | $1.8 | $12,847 |
| 193 | ADZ | PowerShares DB Agriculture Short ETN | 49 | $1.9 | $29,554 |
| 194 | BDG | PowerShares DB Base Metals Long ETN | 47 | $1.6 | $2,887 |
| 195 | DYY | PowerShares DB Commodity Dbl Long ETN | 49 | $11.3 | $168,691 |
| 196 | DEE | PowerShares DB Commodity Dbl Short ETN | 49 | $2.6 | $44,465 |
| 197 | DPU | PowerShares DB Commodity Long ETN | 49 | $6.0 | $37,664 |
| 198 | JGBL | PowerShares DB Japanese G-Bond Fut ETN | 13 | $5.1 | $73,342 |
| 199 | PJB | PowerShares Dynamic Banking | 68 | $13.3 | $57,420 |
| 200 | PIC | PowerShares Dynamic Insurance | 79 | $7.3 | $21,501 |
| 201 | PXN | PowerShares Dynamic Lux Nanotech | 79 | $22.3 | $65,455 |
| 202 | PIQ | PowerShares Dynamic Magniquant | 68 | $18.5 | $22,184 |
| 203 | PXLG | PowerShares Fundamental Pure Large Gr | 11 | $4.4 | $37,970 |
| 204 | PXMC | PowerShares Fundamental Pure Mid Core | 66 | $18.6 | $56,550 |
| 205 | PXSC | PowerShares Fundamental Pure Small Core | 66 | $15.7 | $28,746 |
| 206 | PKN | PowerShares Global Nuclear Energy | 50 | $14.8 | $37,837 |
| 207 | PSTL | PowerShares Global Steel Portfolio | 44 | $3.1 | $15,978 |
| 208 | PWND | PowerShares Global Wind Energy | 47 | $13.0 | $48,672 |
| 209 | PTO | PowerShares Ibbotson Alternative Completion | 48 | $9.2 | $50,353 |
| 210 | KBWX | PowerShares KBW International Financial | 17 | $3.2 | $2,260 |
| 211 | KBWY | PowerShares KBW Premium Yield Equity REIT | 17 | $9.0 | $104,479 |
| 212 | KBWP | PowerShares KBW Property & Casualty Ins | 17 | $5.6 | $35,712 |
| 213 | PMNA | PowerShares MENA Frontier Countries | 46 | $19.6 | $57,610 |
| 214 | PYH | PowerShares Morningstar StockInvestor Core | 66 | $15.3 | $56,431 |
| 215 | IDHQ | PowerShares S&P Intl Developed High Quality | 59 | $17.0 | $47,472 |
| 216 | PSCM | PowerShares S&P SmallCap Materials | 25 | $4.3 | $105,600 |
| 217 | HDG | ProShares Hedge Replication ETF | 10 | $15.8 | $110,649 |
| 218 | IGS | ProShares Short Investment Grade Corporate | 13 | $3.5 | $23,561 |
| 219 | KRS | ProShares Short KBW Regional Banking | 25 | $6.8 | $48,898 |
| 220 | UGE | ProShares Ultra Consumer Goods | 64 | $13.7 | $61,829 |
| 221 | UCD | ProShares Ultra DJ-UBS Commodity | 42 | $9.0 | $55,582 |
| 222 | UJB | ProShares Ultra High Yield | 13 | $4.4 | $135,688 |
| 223 | IGU | ProShares Ultra Investment Grade Corporate | 13 | $2.5 | $259,104 |
| 224 | KRU | ProShares Ultra KBW Regional Banking | 25 | $4.7 | $140,876 |
| 225 | UPV | ProShares Ultra MSCI Europe | 24 | $2.8 | $138,664 |
| 226 | UMX | ProShares Ultra MSCI Mexico Investable Mkt | 24 | $1.9 | $25,448 |
| 227 | UXJ | ProShares Ultra MSCI Pacific Ex-Japan | 24 | $3.1 | $48,896 |
| 228 | UKF | ProShares Ultra Russell 1000 Growth | 63 | $14.5 | $62,186 |
| 229 | UVG | ProShares Ultra Russell 1000 Value | 63 | $7.3 | $41,125 |
| 230 | UKW | ProShares Ultra Russell Midcap Growth | 63 | $12.2 | $84,709 |
| 231 | UVU | ProShares Ultra Russell Midcap Value | 63 | $5.8 | $47,873 |
| 232 | UWC | ProShares Ultra Russell3000 | 34 | $4.5 | $39,973 |
| 233 | LTL | ProShares Ultra Telecommunications | 50 | $3.5 | $25,587 |
| 234 | YCL | ProShares Ultra Yen | 42 | $5.0 | $150,875 |
| 235 | TBZ | ProShares UltraShort 3-7 Year Treasury | 13 | $5.0 | $117,570 |
| 236 | SZK | ProShares UltraShort Consumer Goods | 64 | $2.6 | $61,378 |
| 237 | RXD | ProShares UltraShort Healthcare | 64 | $3.8 | $51,610 |
| 238 | SMK | ProShares UltraShort MSCI Mexico | 35 | $1.8 | $11,452 |
| 239 | JPX | ProShares UltraShort MSCI Pacific ex-Japan | 35 | $2.0 | $30,123 |
| 240 | BIS | ProShares UltraShort Nasdaq Biotechnology | 25 | $4.4 | $105,367 |
| 241 | SFK | ProShares UltraShort Russell 1000 Growth | 63 | $2.1 | $115,906 |
| 242 | SJF | ProShares UltraShort Russell 1000 Value | 63 | $1.7 | $10,199 |
| 243 | SJH | ProShares UltraShort Russell 2000 Value | 63 | $4.6 | $123,746 |
| 244 | SDK | ProShares UltraShort Russell Midcap Growth | 63 | $1.9 | $20,364 |
| 245 | SJL | ProShares UltraShort Russell Midcap Value | 63 | $1.4 | $11,062 |
| 246 | TWQ | ProShares UltraShort Russell3000 | 34 | $1.5 | $33,809 |
| 247 | TLL | ProShares UltraShort Telecom | 50 | $2.3 | $22,147 |
| 248 | TPS | ProShares UltraShort TIPS | 15 | $4.2 | $342,715 |
| 249 | SDP | ProShares UltraShort Utilities | 64 | $3.1 | $116,553 |
| 250 | BTAL | QuantShares U.S. Market Neutral Anti-Beta | 8 | $6.6 | $105,496 |
| 251 | BTAH | QuantShares U.S. Market Neutral High Beta | 8 | $7.9 | $114,934 |
| 252 | MOM | QuantShares U.S. Market Neutral Momentum | 8 | $4.9 | $47,133 |
| 253 | QLT | QuantShares U.S. Market Neutral Quality | 8 | $4.8 | $60,219 |
| 254 | SIZ | QuantShares U.S. Market Neutral Size | 8 | $6.3 | $48,619 |
| 255 | CHEP | QuantShares U.S. Market Neutral Value | 8 | $7.4 | $108,398 |
| 256 | NOMO | QuantShares U.S. Mkt Neutral Anti-Momentum | 8 | $4.7 | $19,112 |
| 257 | DRGS | RBS Global Big Pharma ETN | 6 | $4.5 | $9,376 |
| 258 | TWTI | RBS Oil Trendpilot ETN | 8 | $8.8 | $136,262 |
| 259 | RWW | RevenueShares Financials Sector Fund | 42 | $8.8 | $127,438 |
| 260 | RWV | RevenueShares Navellier Overall A-100 | 40 | $8.1 | $27,399 |
| 261 | HBTA | Russell 1000 High Beta ETF | 11 | $4.9 | $56,824 |
| 262 | HMTM | Russell 1000 High Momentum ETF | 11 | $5.3 | $14,145 |
| 263 | HVOL | Russell 1000 High Volatility ETF | 11 | $4.9 | $3,438 |
| 264 | SHBT | Russell 2000 High Beta ETF | 11 | $4.5 | $14,695 |
| 265 | SHMO | Russell 2000 High Momentum ETF | 11 | $5.1 | $20,740 |
| 266 | SHVY | Russell 2000 High Volatility ETF | 11 | $4.2 | $15,431 |
| 267 | SLBT | Russell 2000 Low Beta ETF | 11 | $5.1 | $21,460 |
| 268 | SLVY | Russell 2000 Low Volatility ETF | 11 | $5.1 | $99,785 |
| 269 | AGRG | Russell Aggressive Growth ETF | 12 | $5.3 | $35,027 |
| 270 | CNTR | Russell Contrarian ETF | 12 | $4.7 | $9,222 |
| 271 | ONEF | Russell Equity ETF | 24 | $5.6 | $37,287 |
| 272 | LWPE | Russell Low P/E ETF | 12 | $4.9 | $24,095 |
| 273 | SGGG | Russell Small Cap Aggressive Growth ETF | 7 | $6.5 | $7,513 |
| 274 | SCOG | Russell Small Cap Consistent Growth ETF | 7 | $6.5 | $37,657 |
| 275 | SCTR | Russell Small Cap Contrarian ETF | 7 | $6.7 | $7,171 |
| 276 | SCLP | Russell Small Cap Low P/E ETF | 7 | $6.7 | $7,790 |
| 277 | VRD | SPDR Nuveen S&P VRDO Municipal Bond ETF | 32 | $15.0 | $118,452 |
| 278 | JPP | SPDR Russell/Nomura PRIME Japan | 66 | $14.8 | $34,362 |
| 279 | IPW | SPDR S&P International Energy | 46 | $11.6 | $65,424 |
| 280 | IPF | SPDR S&P International Financial | 46 | $5.1 | $114,569 |
| 281 | IRV | SPDR S&P International Materials | 46 | $12.4 | $63,180 |
| 282 | IPK | SPDR S&P International Technology | 46 | $14.1 | $40,997 |
| 283 | KME | SPDR S&P Mortgage Finance ETF | 37 | $3.8 | $8,152 |
| 284 | NAGS | Teucrium Natural Gas Fund | 15 | $1.7 | $35,271 |
| 285 | SOYB | Teucrium Soybean Fund | 7 | $5.5 | $89,035 |
| 286 | CANE | Teucrium Sugar Fund | 7 | $3.7 | $38,863 |
| 287 | WEAT | Teucrium Wheat Fund | 7 | $5.1 | $55,524 |
| 288 | CRUD | Teucrium WTI Crude Oil Fund | 14 | $3.5 | $51,661 |
| 289 | VXAA | UBS ETRACS 1-Mth S&P 500 VIX Futures ETN | 8 | $4.0 | $44,381 |
| 290 | MLPS | UBS ETRACS 1x Mthly Short Alerian MLP ETN | 19 | $6.9 | $4,702 |
| 291 | VXBB | UBS ETRACS 2-Mth S&P 500 VIX Futures ETN | 8 | $5.2 | $15,784 |
| 292 | VXCC | UBS ETRACS 3-Mth S&P 500 VIX Futures ETN | 8 | $6.3 | $14,581 |
| 293 | VXDD | UBS ETRACS 4-Mth S&P 500 VIX Futures ETN | 8 | $6.6 | $6,760 |
| 294 | VXEE | UBS ETRACS 5-Mth S&P 500 VIX Futures ETN | 8 | $7.1 | $9,819 |
| 295 | VXFF | UBS ETRACS 6-Mth S&P 500 VIX Futures ETN | 8 | $7.7 | $5,040 |
| 296 | MLPG | UBS ETRACS Alerian Natural Gas MLP ETN | 22 | $15.4 | $58,269 |
| 297 | UBN | UBS ETRACS CMCI Energy TR ETN | 50 | $3.2 | $8,492 |
| 298 | UBM | UBS ETRACS CMCI Industrial Metals TR ETN | 50 | $5.6 | $84,364 |
| 299 | UBC | UBS ETRACS CMCI Livestock TR ETN | 50 | $4.5 | $108,599 |
| 300 | PTD | UBS ETRACS CMCI Short Platinum ER ETN | 48 | $3.4 | $2,462 |
| 301 | DDVX | UBS ETRACS Daily Shrt 4-M S&P VIX Fut ETN | 8 | $13.0 | $47,061 |
| 302 | EEVX | UBS ETRACS Daily Shrt 5-M S&P VIX Fut ETN | 8 | $12.3 | $57,191 |
| 303 | FFVX | UBS ETRACS Daily Shrt 6-M S&P VIX Fut ETN | 8 | $11.5 | $4,941 |
| 304 | SSDD | UBS ETRACS ISE Solid State Drive ETN | 8 | $12.3 | $32,850 |
| 305 | EIPL | UBS ETRACS M 2x Lvr Next Gen Internet ETN | 9 | $3.7 | $1,573 |
| 306 | LSKY | UBS ETRACS Mth 2x ISE Cloud Comptng ETN | 7 | $15.8 | $35,311 |
| 307 | SSDL | UBS ETRACS Mth 2x ISE Solid State Drv ETN | 8 | $13.9 | $28,006 |
| 308 | EIPO | UBS ETRACS Next Generation Internet ETN | 9 | $6.7 | $2,782 |
| 309 | OILZ | UBS ETRACS Oil Futures Contango ETN | 11 | $10.2 | $17,073 |
| 310 | BDCS | UBS ETRACS Wells Fargo BDC ETN | 12 | $14.3 | $64,071 |
| 311 | MLPW | UBS ETRACS Wells Fargo MLP Index ETN | 18 | $19.8 | $55,739 |
| 312 | VTWV | Vanguard Russell 2000 Value ETF | 20 | $12.4 | $84,885 |
| 313 | IVOV | Vanguard S&P Mid-Cap 400 Value ETF | 20 | $12.7 | $31,448 |
| 314 | IPAL | VelocityShares 2x Inverse Palladium ETN | 7 | $1.7 | $25,677 |
| 315 | IPLT | VelocityShares 2x Inverse Platinum ETN | 7 | $2.7 | $16,209 |
| 316 | LPAL | VelocityShares 2x Long Palladium ETN | 7 | $3.3 | $71,934 |
| 317 | LPLT | VelocityShares 2x Long Platinum ETN | 7 | $3.4 | $60,165 |
| 318 | DGLD | VelocityShares 3x Inverse Gold ETN | 7 | $2.3 | $585,838 |
| 319 | VIIZ | VelocityShares VIX Medium-Term ETN | 17 | $7.9 | $79,723 |
| 320 | SZR | WisdomTree Dreyfus S. African Rand | 47 | $4.9 | $71,047 |
| 321 | EU | WisdomTree Euro Debt Fund | 48 | $4.7 | $26,613 |
| 322 | RRF | WisdomTree Global Real Return Fund | 10 | $4.8 | $25,672 |
| 323 | ROI | WisdomTree LargeCap Growth | 41 | $20.2 | $71,274 |
| 324 | GULF | WisdomTree Middle East Dividend | 46 | $13.7 | $86,172 |
Data sources: Daily prices and volume of individual ETPs from Norgate Premium Data. All other information compiled by Invest With An Edge from sources believed to reliable.
Past issues of ETF Deathwatch are available here.
Disclosure covering writer, editor, and publisher: No positions in any of the securities mentioned. No positions in any of the companies or ETF sponsors mentioned. No income, revenue, or other compensation (either directly or indirectly) received from, or on behalf of, any of the companies or ETF sponsors mentioned.