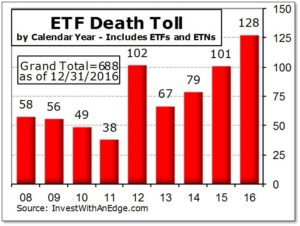
 A total of 128 U.S.-listed exchange-traded funds (“ETFs”) and exchange-traded notes (“ETNs”) had their listings removed in 2016, easily establishing a new ETF closures record. Of the 2,652 U.S. exchange-traded products (“ETPs”) launched since 1993, when the industry began, only 1,964 remain, putting the lifetime death toll at 688 (574 ETFs and 114 ETNs). This pushes the mortality rate to 25.9%, up from 23.3% a year ago. More than a quarter of all ETFs and ETNs have failed to survive.
Two additional closure-related records were broken in 2016: (1) the largest closure ever and (2) the most closure-related assets affected in a single year. More than $1.5 billion was residing in the VelocityShares 3x Long Crude ETN (former ticker UWTI) on November 16 when it announced its delisting, surpassing the combined assets of the previous two largest closures. The previous record holder was PowerShares DB Crude Oil Double Long ETN (former ticker DXO), which held $600 million when it closed back in 2009. Calendar year 2016 also produced the third-largest closing ever, the $508 million in the CS X-Links Cushing MLP Infrastructure ETN (former ticker MLPN) in November.
Assets in the 128 ETFs and ETNs closed in 2016 held a record $5.4 billion at the time their closures were announced, which was double the 2015 amount. Granted, owners removed many of those assets between announcement day and liquidation day, but the fact remains that closures impacted a large number of investors.
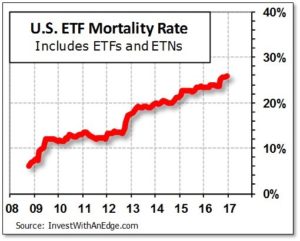 The ETF mortality rate continues on its relentless upward trend. The total number of closures divided by the total launches was only 7.4% at the end of 2008. Today, just eight years later, that figure has more than tripled to 25.9%, breaking above the 25% threshold for the first time ever with August’s record-setting 41 closures. Every new product brought to market is now facing tougher odds than ever before.
Closures affected 32 unique brands with AccuShares, Calamos, Fallah, and MAXIS making a complete exit. Sponsors and brands with the highest closure quantities for the year included State Street SPDRs (17), BlackRock iShares (14), Deutsche Bank (11), and UBS ETRACS (10). SPDRs and iShares are probably the two most recognized ETF brands, indicating that even the “big boys” in the ETF playground believe that pruning is a necessary requirement for healthy growth.
The 128 closures consisted of 99 ETFs and 29 ETNs. As for their strategy implementation approaches, 15 employed active management, 32 used smart-beta indexes, and 81 were based on traditional capitalization-weighted benchmarks. Within our broadly defined categories, the largest closure counts were Global and International (31), Leveraged & Inverse (27), Style & Strategy (23), Fixed Income (22), Sectors (13), Commodity (7), Volatility (4), and Currency (1).
Six of the ETF closures were planned years in advance. When launched, target maturity bond ETFs announce their maturity and liquidation date. Therefore, the four iShares iBonds ETFs and two Guggenheim BulletShares ETFs that matured and liquidated in 2016 are not typical closings.
Another new twist noticed for the first time this year was the concept of “forced delistings” initiated by the stock exchanges. The NYSE delisted the DB Commodity Long ETN (former ticker DPU) after the close on April 15 and DB Base Metals Long ETN (former ticker BDG) after the close on September 16. The reason was these ETNs failed to maintain at least $400,000 in assets. BATS delisted the ProShares CDS North American HY Credit (former ticker TYTE) after the close of trading on May 18 because the ETF had fewer than 50 beneficial owners.
Not all delistings results in liquidation and the return of shareholder money. Four products fall into that category for 2016. The failure of Deutsche Bank to redeem the two commodity ETNs mentioned above did not affect too many shareholders. However, the decision by Credit Suisse to not redeem or otherwise liquidate the VelocityShares 3x Long Crude Oil ETN (former ticker UWTI) and VelocityShares 3x Inverse Crude Oil ETN (former ticker DWTI) is a different matter. The 3x long product held $1.57 billion when the delisting was announced, making it the largest closure in history. The 3x inverse version had $227 million in assets, making it a significant event also.
The average age of funds closing in 2016 was 47.7 months—just short of the 4-year mark, so sponsors are giving these products ample opportunity to succeed. Ages ranged from a low of just 2.4 months for the AccuShares teeter-totter oil funds (former tickers OILU and OILD) to the ripe old age of 119.4 months (almost 10 years) for three WisdomTree ETFs.
The interactive table below listing all 128 closures for 2016 is currently sorted by product name.
ETF and ETN Closures of 2016
| # | Ticker | Name | Last Day | AUM ($M) | A/SB/I | Notes: |
|---|---|---|---|---|---|---|
| 1 | OILD | AccuShares S&P GSCI Crude Oil Down (C-corp) | 09/08/2016 | 2.7 | I | |
| 2 | OILU | AccuShares S&P GSCI Crude Oil Up (C-corp) | 09/08/2016 | 2.2 | I | |
| 3 | VXDN | AccuShares Spot CBOE VIX Down (C-corp) | 09/08/2016 | 0.7 | I | |
| 4 | VXUP | AccuShares Spot CBOE VIX Up (C-corp) | 09/08/2016 | 0.8 | I | |
| 5 | EPRO | AdvisorShares EquityPro | 10/21/2016 | 16.0 | A | |
| 6 | YPRO | AdvisorShares YieldPro | 10/24/2016 | 18.3 | A | |
| 7 | PUTX | ALPS Enhanced Put Write Strategy | 06/24/2016 | 2.5 | A | |
| 8 | SLDR | ALPS Sector Leaders | 03/24/2016 | 1.1 | SB | |
| 9 | SLOW | ALPS Sector Low Volatility | 03/24/2016 | 1.2 | SB | |
| 10 | STXX | ALPS STOXX Europe 600 | 03/24/2016 | 5.4 | I | |
| 11 | OSMS | Barclays OFI SteelPath MLP ETN | 06/21/2016 | 0.6 | I | |
| 12 | CFGE | Calamos Focused Growth | 08/01/2016 | 26.0 | A | |
| 13 | RPX | Columbia Large Cap Growth | 01/28/2016 | 14.1 | A | |
| 14 | RWG | Columbia Select Large Cap Growth | 01/28/2016 | 7.1 | A | |
| 15 | GVT | Columbia Select Large Cap Value | 01/28/2016 | 6.7 | A | |
| 16 | WIZE | CrowdInvest Wisdom | 09/27/2016 | 2.6 | SB | |
| 17 | CSCB | CS X-Links Commodity Benchmark ETN | 01/27/2016 | 1.1 | I | |
| 18 | MLPN | CS X-Links Cushing MLP Infrastructure ETN | 11/25/2016 | 508.1 | I | |
| 19 | CSMA | CS X-Links Merger Arbitrage ETN | 06/10/2016 | 4.3 | SB | |
| 20 | CVOL | C-Tracks Citi Volatility Index TR ETN | 05/23/2016 | 2.4 | I | |
| 21 | BUNT | DB 3x German Bund Futures ETN | 09/19/2016 | 21.8 | I | |
| 22 | JGBD | DB 3x Inverse Japanese Govt Bond Futures ETN | 09/19/2016 | 28.0 | I | |
| 23 | JGBT | DB 3x Japanese Govt Bond Futures ETN | 09/19/2016 | 5.5 | I | |
| 24 | LBND | DB 3x Long 25+ Treasury Bond ETN | 09/19/2016 | 11.1 | I | |
| 25 | SBND | DB 3x Short 25+ Treasury Bond ETN | 09/19/2016 | 26.7 | I | |
| 26 | BDG | DB Base Metals Long ETN | 09/16/2016 | 0.4 | I | 3,4 |
| 27 | DPU | DB Commodity Long ETN | 04/15/2016 | 0.4 | I | 3,4 |
| 28 | BUNL | DB German Bund Futures ETN | 09/19/2016 | 14.4 | I | |
| 29 | JGBS | DB Inverse Japanese Govt Bond Futures ETN | 09/19/2016 | 12.3 | I | |
| 30 | JGBL | DB Japanese Govt Bond Futures ETN | 09/19/2016 | 2.7 | I | |
| 31 | LLDM | Direxion Daily FTSE Developed Markets Bull 1.25x | 10/07/2016 | 1.3 | I | |
| 32 | LLEM | Direxion Daily FTSE Emerging Markets Bull 1.25x | 10/07/2016 | 1.2 | I | |
| 33 | HEGE | Direxion Daily MSCI Europe Currency Hedged Bull 2x | 05/20/2016 | 1.5 | I | |
| 34 | HEGJ | Direxion Daily MSCI Japan Currency Hedged Bull 2x | 05/20/2016 | 1.2 | I | |
| 35 | TOTS | Direxion Daily Total Market Bear 1x | 07/15/2016 | 2.7 | I | |
| 36 | VSPY | Direxion S&P 500 Volatility Response | 10/07/2016 | 8.3 | SB | |
| 37 | VLLV | Direxion Value Line Conservative Equity | 03/23/2016 | 1.2 | SB | |
| 38 | VLML | Direxion Value Line Mid- and Large-Cap High Dividend | 03/23/2016 | 6.7 | SB | |
| 39 | VLSM | Direxion Value Line Small- and Mid-Cap High Dividend | 03/23/2016 | 11.6 | SB | |
| 40 | LSC | ELEMENTS S&P Commodity Trends Idr ETN | 09/16/2016 | 27.5 | SB | |
| 41 | SBEU | ETFS Diversified-Factor Developed Europe | 11/21/2016 | 1.2 | SB | |
| 42 | SBUS | ETFS Diversified-Factor U.S. Large Cap | 11/21/2016 | 7.8 | SB | |
| 43 | WITE | ETFS Physical White Metal Basket Shares | 03/02/2016 | 15.7 | I | |
| 44 | MLPL | ETRACS 2x Mthly Alerian MLP Infra ETN | 01/29/2016 | 218.9 | I | 2 |
| 45 | MLPV | ETRACS 2xMonthly Leveraged S&P MLP ETN | 01/29/2016 | 14.5 | I | 2 |
| 46 | XVIX | ETRACS Daily Long-Short VIX ETN | 08/17/2016 | 13.1 | SB | |
| 47 | DVHI | ETRACS Diversified High Income ETN | 08/15/2016 | 23.3 | I | |
| 48 | HOMX | ETRACS ISE Exclusively Homebuilders ETN | 08/17/2016 | 22.7 | I | |
| 49 | RWXL | ETRACS Mthly Pay 2x DJ Intl Real Est ETN | 08/15/2016 | 12.7 | I | |
| 50 | SPGH | ETRACS S&P 500 Gold Hedged Idx ETN | 08/17/2016 | 23.1 | I | |
| 51 | VQTS | ETRACS S&P 500 VEQTOR Switch Index ETN | 08/17/2016 | 21.9 | SB | |
| 52 | FMLP | ETRACS Wells Fargo MLP Ex-Energy ETN | 08/15/2016 | 15.9 | I | |
| 53 | MLPW | ETRACS Wells Fargo MLP Index ETN | 08/15/2016 | 9.4 | I | |
| 54 | FIA | Falah Russell-IdealRatings U.S. Large Cap | 07/14/2016 | 1.3 | SB | |
| 55 | CRBQ | Global Commodity Equity | 03/24/2016 | 16.2 | I | |
| 56 | CHNB | Global X GF China Bond | 04/18/2016 | 22.2 | I | |
| 57 | BSCG | Guggenheim BulletShares 2016 Corp Bond | 12/29/2016 | 403.8 | I | 1 |
| 58 | BSJG | Guggenheim BulletShares 2016 HY Corp Bond | 12/29/2016 | 364.1 | I | 1 |
| 59 | EMRE | Guggenheim Emerging Markets Real Estate | 09/20/2016 | 2.3 | I | |
| 60 | EWRI | Guggenheim Russell 1000 Equal Weight | 01/26/2016 | 74.0 | SB | |
| 61 | HHDG | Highland HFR Equity Hedge | 04/11/2016 | 1.9 | SB | |
| 62 | DRVN | Highland HFR Event-Driven | 04/11/2016 | 2.5 | SB | |
| 63 | HHFR | Highland HFR Global | 04/11/2016 | 2.8 | SB | |
| 64 | HKOR | Horizons Korea KOSPI 200 | 04/29/2016 | 1.7 | I | |
| 65 | QLTC | iShares B – Ca Rated Corporate Bond | 08/23/2016 | 11.3 | I | |
| 66 | QLTB | iShares Baa – Ba Rated Corporate Bond | 08/23/2016 | 36.1 | I | |
| 67 | IEIL | iShares Enhanced International Large-Cap | 08/23/2016 | 68.2 | A | |
| 68 | IEIS | iShares Enhanced International Small-Cap | 08/23/2016 | 19.3 | A | |
| 69 | IELG | iShares Enhanced U.S. Large-Cap | 08/23/2016 | 82.0 | A | |
| 70 | IESM | iShares Enhanced U.S. Small-Cap | 08/23/2016 | 24.8 | A | |
| 71 | GTIP | iShares Global Inflation-Linked Bond | 08/23/2016 | 14.6 | I | |
| 72 | IBDF | iShares iBonds Dec 2016 Term Corporate | 12/15/2016 | 65.0 | I | 1 |
| 73 | IBCB | iShares iBonds Mar 2016 Term Corp ex-Financials | 03/29/2016 | 34.9 | I | 1 |
| 74 | IBDA | iShares iBonds Mar 2016 Term Corporate | 03/29/2016 | 65.6 | I | 1 |
| 75 | IBME | iShares iBonds Sep 2016 Term Muni Bond | 09/01/2016 | 121.6 | I | 1 |
| 76 | ITIP | iShares International Inflation-Linked Bond | 08/23/2016 | 25.0 | I | |
| 77 | EMHZ | iShares MSCI Emerging Markets Horizon | 08/23/2016 | 2.9 | SB | |
| 78 | EEML | iShares MSCI Emerging Mkts Latin America | 08/23/2016 | 8.3 | I | |
| 79 | ERW | Janus Equal Risk Weighted Large Cap | 02/24/2016 | 2.3 | SB | |
| 80 | NKY | MAXIS Nikkei 225 | 03/11/2016 | 43.7 | I | |
| 81 | RWV | Oppenheimer Navellier Overall A-100 Revenue | 12/15/2016 | 7.1 | SB | |
| 82 | PAEU | Pacer Autopilot Hedged European | 12/22/2016 | 2.6 | I | |
| 83 | CHNA | PowerShares China A-Share | 03/18/2016 | 5.5 | A | |
| 84 | PFEM | PowerShares Fundamental Emerging Markets Local Debt | 03/18/2016 | 4.2 | SB | |
| 85 | KBWC | PowerShares KBW Capital Markets | 03/18/2016 | 11.2 | I | |
| 86 | KBWI | PowerShares KBW Insurance | 03/18/2016 | 14.4 | I | |
| 87 | TYTE | ProShares CDS North American HY Credit | 05/18/2016 | 2.0 | A | 4 |
| 88 | FUTS | ProShares Managed Futures Strategy | 03/18/2016 | 7.1 | SB | |
| 89 | IGS | ProShares Short Investment Grade Corporate | 08/25/2016 | 2.6 | I | |
| 90 | UCD | ProShares Ultra Bloomberg Commodity | 08/25/2016 | 12.4 | I | |
| 91 | HBU | ProShares Ultra Homebuilders & Supplies | 08/25/2016 | 0.9 | I | |
| 92 | IGU | ProShares Ultra Investment Grade Corporate | 08/25/2016 | 3.2 | I | |
| 93 | UXJ | ProShares Ultra MSCI Pacific Ex-Japan | 08/25/2016 | 1.4 | I | |
| 94 | CMD | ProShares UltraShort Bloomberg Commodity | 08/25/2016 | 6.4 | I | |
| 95 | HBZ | ProShares UltraShort Homebuilders & Supplies | 08/25/2016 | 0.8 | I | |
| 96 | GDJS | ProShares UltraShort Junior Miners | 08/25/2016 | 0.2 | I | |
| 97 | JPX | ProShares UltraShort MSCI Pacific ex-Japan | 08/25/2016 | 1.1 | I | |
| 98 | UK | Recon Capital FTSE 100 | 03/10/2016 | 1.0 | I | |
| 99 | IJNK | SPDR Barclays International High Yield Bond | 08/24/2016 | 25.7 | I | |
| 100 | EMCD | SPDR BofA Merrill Lynch Emg Mkts Corp Bond | 08/24/2016 | 14.8 | I | |
| 101 | XLFS | SPDR Financial Services Select Sector | 11/14/2016 | 140.1 | I | |
| 102 | EMFT | SPDR MSCI EM 50 | 08/24/2016 | 2.1 | I | |
| 103 | EMBB | SPDR MSCI EM Beyond BRIC | 08/24/2016 | 2.6 | I | |
| 104 | HREX | SPDR MSCI International Real Estate Currency Hedged | 11/14/2016 | 2.1 | I | |
| 105 | QMEX | SPDR MSCI Mexico StrategicFactors | 11/14/2016 | 2.2 | SB | |
| 106 | QKOR | SPDR MSCI South Korea StrategicFactors | 11/14/2016 | 2.8 | SB | |
| 107 | QTWN | SPDR MSCI Taiwan StrategicFactors | 11/14/2016 | 5.9 | SB | |
| 108 | BABS | SPDR Nuveen Barclays Build America Bond | 08/24/2016 | 61.3 | I | |
| 109 | CXA | SPDR Nuveen Barclays California Muni Bond | 08/24/2016 | 149.3 | I | |
| 110 | INY | SPDR Nuveen Barclays New York Muni Bond | 08/24/2016 | 34.4 | I | |
| 111 | JPP | SPDR Russell/Nomura PRIME Japan | 08/24/2016 | 27.7 | I | |
| 112 | JSC | SPDR Russell/Nomura Small Cap Japan | 08/24/2016 | 54.1 | I | |
| 113 | BIK | SPDR S&P BRIC 40 | 08/24/2016 | 73.3 | I | |
| 114 | MDD | SPDR S&P International Mid Cap | 08/24/2016 | 49.2 | I | |
| 115 | RORO | SPDR SSgA Risk Aware | 08/24/2016 | 2.0 | A | |
| 116 | BITE | The Restaurant ETF | 12/22/2016 | 1.4 | SB | |
| 117 | FCFI | TrimTabs Intl Free-Cash-Flow | 10/31/2016 | 13.1 | SB | |
| 118 | FBG | UBS AG FI Enhanced Big Cap Growth ETN | 08/17/2016 | 151.8 | I | |
| 119 | MES | VanEck Vectors Gulf States | 10/07/2016 | 6.9 | I | |
| 120 | IDXJ | VanEck Vectors Indonesia Small-Cap | 10/07/2016 | 5.9 | I | |
| 121 | DWTI | VelocityShares 3x Inverse Crude ETN | 12/08/2016 | 226.8 | I | 3 |
| 122 | UWTI | VelocityShares 3x Long Crude ETN | 12/08/2016 | 1,568.5 | I | 3 |
| 123 | TONS | WisdomTree Coal Fund | 09/22/2016 | 1.1 | I | |
| 124 | CCXE | WisdomTree Commodity Country Equity | 09/22/2016 | 7.2 | SB | |
| 125 | CCX | WisdomTree Commodity Currency Strategy | 09/22/2016 | 5.0 | A | |
| 126 | DBU | WisdomTree Global ex-U.S. Utility | 09/22/2016 | 15.0 | SB | |
| 127 | GNAT | WisdomTree Global Natural Resources | 09/22/2016 | 16.9 | SB | |
| 128 | JGBB | WisdomTree Japan Interest Rate Strategy | 09/22/2016 | 4.4 | SB |
The A/SB/I column indicates Actively Managed, Smart Beta, or traditional Index. AUM = Assets Under Management (in $ millions) at time closure was announced. Actual amount of assets liquidated will be lower. Notes: (1) reached planned maturity, (2) early termination triggered, (3) delisted but not liquidated, (4) forced delisting. All exchange-traded notes are identified with “ETN” as part of their name description.
Additional resources:
- Five Steps to Avoid Disaster When Your ETF Closes
- List of 101 ETF Closures in 2015
- List of 79 ETF Closures in 2014
- List of 67 ETF Closures in 2013
- List of 102 ETF Closures in 2012
- List of 38 ETF Closures in 2011
- List of 49 ETF Closures in 2010
- List of 56 ETF Closures in 2009
- List of 58 ETF Closures in 2008
- Catalog of ETF Closure Articles
Disclosure: Author has no positions in any of the securities, companies, or ETF sponsors mentioned. No income, revenue, or other compensation (either directly or indirectly) is received from, or on behalf of, any of the companies or ETF sponsors mentioned.