The Market Leadership Strategy is designed to be a small portion of your overall investment portfolio. Our goal: to provide an easy-to-use investment approach with a potential for powerful returns.
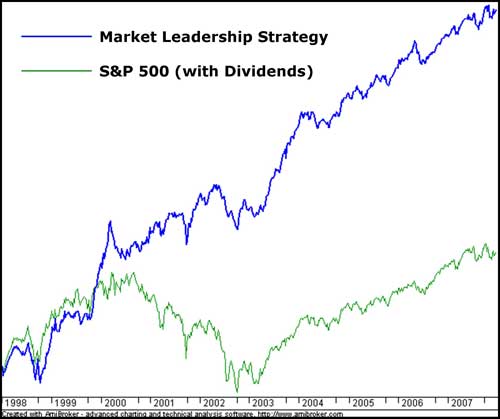
Our hypothetical backtested results indicates a potential for almost 20% annualized returns for the past 10 years. All this with less risk than the S&P 500! See below for historical results and how to implement this strategy.
RANKINGS & RECOMMENDATIONS
Rankings Updated 12/22/08 with 12/19/08 data.
Data Updated Every Monday by 12:00 pm Central Time
See list of applicable ETFs to trade.
| Rank | Style Description | Representative Index |
| 1 | Money Market | Money Market |
| 2 | US Small Cap Value | Russell 2000 Value® Index |
| 3 | Developed International | MSCI EAFE® Index |
| 4 | Global Stocks | S&P Global 100® Index |
| 5 | US Large Cap Value | Russell 1000 Value® Index |
| 6 | US Mega Cap | Russell Top 50® Index |
| 7 | US Small Cap Blend | Russell 2000® Index |
| 8 | US Total Market | Russell 3000® Index |
| 9 | US Large Cap Blend | Russell 1000® Index |
| 10 | US Micro Cap | Russell Microcap® Index |
| 11 | US Small Cap Growth | Russell 2000 Growth® Index |
| 12 | US Mid Cap Value | Russell Midcap Value® Index |
| 13 | US Mid Cap Blend | Russell Midcap® Index |
| 14 | US Aggressive Growth | Nasdaq 100® Index |
| 15 | US Mid Cap Growth | Russell Midcap Growth® Index |
| 16 | US Large Cap Growth | Russell 1000 Growth® Index |
The Market Leadership Strategy always has two holdings with nominal weighting of 50% each. Based on the rankings, one of the positions can be a money market fund. This strategy will buy the top two (2) ranked funds and hold them as long as they are ranked as a top-5 fund.
If a holding drops below #5, the strategy will sell it and purchase the highest ranked style not already owned. Additional information on interpreting and following this strategy can be found below.
AllStarInvestor.com is not affiliated with any of the index providers mentioned above. The twelve named Russell indexes are registered trademarks of Russell Investments. The Nasdaq 100® Index is the registered trademark of Nasdaq. The MSCI EAFE® Index is the registered trademark of Morgan Stanley Capital International. The S&P Global 100® Index is the registered trademark of Standard and Poor’s.
All About
MARKET LEADERSHIP STRATEGY
Following the Strategy
This investment program assumes you invest in just two (2) positions, equally weighted at 50% each.
- Get started by purchasing the top two ranked indexes that are highlighted in GREEN.
Since you cannot buy an index outright, buy an equivalent Exchange Traded Fund – ETF.
See this chart for equivalent ETFs here. - Continue to hold those two securities as long as they remain among the top five ranked securities highlighted in GREEN or YELLOW. Average hold time of a fund is 5.5 months.
- When one of your holdings drops lower in the rankings and is highlighted in TAN, then it is time to sell that index.
- When you sell an index, Buy the highest ranked index highlighted in GREEN that you don’t already own.
- That’s it!
Different Possibilities
As you probably know, it’s not possible to invest directly in an index. However, there are many Exchange Traded Funds (ETFs), mutual funds, and variable annuity subaccounts that are based on these and other similar indexes.
For example, when the strategy says Buy Large Cap Growth, you have many ways to implement that recommendation. You could buy iShares Russell 1000 Growth (IWF), iShares S&P 500 Growth Index Fund (IVW), PowerShares Dynamic Large Cap Growth Portfolio (PWB), the large cap growth offering in your company’s 401(k) plan, or a multitude of other large cap growth funds.
There are a wide range of ETF and mutual fund providers that have offerings based on the styles and indexes recommended by the Market Leadership Strategy. You have the flexibility to use whichever is most convenient for you. Use index funds and ETFs from providers like Vanguard, S&P, Russell, Morningstar, PowerShares, WisdomTree, Dow Jones Wilshire, AlphaDEX, or your favorite fund family. See our list of representative ETFs here.
How the Strategy Works
 Our ranking system is a multi-factor ranking strategy. Every week we analyze the 16 different investment options looking at trend quality, alpha, price momentum, and risk. These multiple factors are then combined to produce our easy-to-use ranking table. We are not trying to capture the daily or weekly gyrations among these indexes, instead focusing on the longer-term prospects, or the true leadership qualities of those indexes. As a result, turnover is relatively low, with each position being held an average of more than four months during the 10-year backtest period.
The 16 Indexes
We start with the nine styles popularized by the Morningstar style box. It’s a good start, but Morningstar had to leave out many investment choices in order to keep everything in a nice and tidy nine-square box. By adding a mega-cap index and a micro-cap index, a larger range of capitalization sizes is now available.
We chose the Russell indexes to represent these 11 segments because of the low degree of overlap between each segment. By adding the Nasdaq 100, an aggressive growth index is now an option. Sometimes, the entire US market is performing well, so a total US market index, such as the Russell 3000 or Dow Jones Wilshire 5000 is a good choice. However, even with those 13 indexes, there are no international options. Therefore we added, the MSCI EAFE index of developed international markets, and the S&P Global 100 Index that represents both domestic and international equities.
We round out our universe of choices with the addition of a money market fund to help control risk.
Historical Testing
| Market Leadership Strategy | ||
| Hypothetical Performance Results | ||
| 10-years 12/31/1997 – 12/31/2007 | ||
| Parameter | Market Leadership Strategy | S&P 500 Total Return |
| Annualized Return | 19.8% | 5.9% |
| Cumulative Return | 507.1% | 77.2% |
| Standard Deviation | 16.0% | 18.0% |
| Maximum Drawdown | -21.5% | -47.4% |
| Sharpe Ratio | 1.01 | 0.12 |
| r-squared | 0.67 | 1.00 |
| Beta | 0.73 | 1.00 |
| Alpha (traditional) | 15.1% | 0 |
| Non-correlated Alpha | 14.6% | 0 |
| # Trades | 55 | n/a |
| Avg Holding Time (mths) | 4.4 | n/a |
Annual Performance
| YEAR | MLS | S&P |
| 1998 | 14.8% | 28.6% |
| 1999 | 47.7% | 21.0% |
| 2000 | 19.9% | -9.1% |
| 2001 | 17.3% | -11.9% |
| 2002 | -7.7% | -22.1% |
| 2003 | 57.3% | 28.7% |
| 2004 | 16.9% | 10.9% |
| 2005 | 13.0% | 4.9% |
| 2006 | 19.0% | 15.8% |
| 2007 | 11.5% | 5.5% |