Most people understand the concept of a spot market. It’s the place where goods and services are bought and sold for immediate delivery. When you go to the supermarket, it is a spot market transaction because you take immediate delivery of goods in exchange for cash, check, or credit card payment.
There are spot markets for nearly every conceivable transaction. When you buy a house, it essentially becomes a spot transaction on the day of closing when money (often secured with a loan) is exchanged for ownership and the right of possession. Commodities can be bought and sold the same way – crude oil, gold, and soybeans transactions can take place in spot markets at spot market prices. However, for most investors this is impractical because of the quantities involved. Not many people are in a position to deliver or take delivery of 5,000 bushels of soybeans.
Instead, futures contracts are the financial instruments used for most commodity transactions. A futures contract does not require immediate delivery, allowing them to be bought by someone that has no intention of taking delivery as long as they sell that contract before the delivery date. If you believe the price of crude oil is going to rise between now and the end of the year, you can buy crude oil futures today and hopefully sell them before the contract expires for a profit. Prices fluctuate, and therefore the price of a futures contract (with a future delivery date) is different than spot prices (with immediate delivery).
One commodity where retail investors can execute transactions very close to spot prices is gold bullion. This is because gold doesn’t require much physical space, allowing banks and funds to physically deliver or take delivery of the commodity. It is relatively easy to store $1 million in gold, but where would you put $1 million of soybeans?
Outside of gold, the ability to buy and sell at spot prices has long eluded the financial community. There have been some futile attempts at introducing exchange traded funds (“ETFs”) designed to track spot prices. A firm called MacroShares launched a pair of crude oil ETFs in 2006, another pair in 2008, and ETFs intended to track housing prices in 2009. Since these funds could not buy and store crude oil, let alone single-family homes, they had to devise another approach. They were issued in pairs with one member supposedly increasing in value with rising prices while the other did the opposite and increased in value with falling prices. The pair were configured in a teeter-totter arrangement, where the funds would exchange cash each day based on the amount of change in the price of oil. The housing ETFs did the same thing, except the value exchanged was only determined once per month by the Case-Shiller Housing Index.
All of these products failed to track spot prices because they failed to embrace the basic structure of ETFs – namely the ability to create and redeem shares with in-kind exchanges to meet supply and demand. This basic ETF structure is what keeps market prices closely aligned to the net asset values of ETFs.
Recently, another firm (AccuShares) introduced ETFs designed to track the spot price of the CBOE Volatility Index (“VIX”). The approach is again based on a teeter-totter arrangement that lacks the ability to create and redeem shares at net asset value on a daily basis. As a result, the products are tracking futures prices instead of spot prices. The search for the Holy Grail of spot market investing goes on.
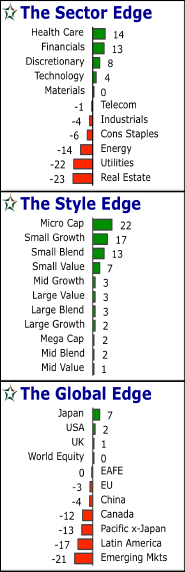
Sectors
The quantity of sectors in the green improved by one this week as Materials went from a momentum reading of -1 to the plus side of zero. That is not much from a qualitative standpoint, but the line must be drawn somewhere. Health Care sits at the top again this week, although it is now facing a stiff challenge from Financials for top-ranked honors. The relative order of the 11 sector categories is identical to a week ago. Therefore, Consumer Discretionary, Technology, and Materials round out the top-five spots. The two highest yielding categories, Real Estate and Utilities, remain on the bottom.
Styles
The pattern visible in the style rankings is somewhat unique again this week. There is a near-linear falloff in the momentum scores in the upper portion while the lower-ranked categories produced nearly identical readings. The four categories at the top that have separated themselves from the pack happen to be the four smallest capitalization segments. Micro-Cap is in first for a second week, and the three Small-Cap categories are right below it. There was no change in the relative order of the top-five groups, and they all gained strength the past week. Four styles had small negative momentum readings a week ago, and today they are all back in the plus column. Large-Cap Value was the big mover, climbing from tenth to sixth, although that move only required a small boost in momentum due to the tight range of the lower-ranked style categories.
Global
China has been at the top of the global rankings for all but nine of the past 26 weeks. Japan held the honors during those other nine weeks. China plunged from first to seventh this week, and Japan stepped up from second to take the lead. However, Japan is currently sporting just a single-digit momentum reading, which makes the country’s position somewhat precarious. The US now occupies the #2 spot, and the UK jumped four places higher to land in third, with strength in the British Pound being a contributing factor. World Equity moved to the plus side of zero, increasing the number of global categories in the green from three to four. EAFE and Europe are in the middle again, and China joined them this week as it fell from first to seventh. Canada, Pacific ex-Japan, and Latin America all showed improvement yet continue to post double-digit negative momentum scores. Weakness in China pulled the Emerging Markets category two spots lower to land on the bottom.
Note:
The charts above depict both the relative strength and absolute strength of various market sectors, styles, and geographic locations on an intermediate-term basis. Each grouping is sorted (top to bottom) by relative strength. The magnitude of the displayed RSM value is a measure of absolute strength, which is our proprietary method of measuring and reporting the intermediate-term strength as an annualized value.
“Here may be found the last words of Joseph of Aramathia. He who is valiant and pure of spirit may find the holy grail in the Castle of Aaauuuggghhh…”
inscription on a rock from the movie Monty Python and the Holy Grail (1975)
DISCLOSURE
© 2015 AllStarInvestor.com All Rights Reserved. Protected by copyright laws of the United States and international treaties. Nothing in this e-mail should be considered personalized investment advice. Although our employees may answer your general customer service questions, they are not licensed under securities laws to address your particular investment situation. No communication by our employees to you should be deemed as personalized investment advice. Any investments recommended in this letter should be made only after consulting with your investment advisor and only after reviewing the prospectus or financial statements of the company. All Star Investor employees, its affiliates, and clients may hold positions in the recommended securities.
Distribution is encouraged. Please do not alter content.