 ETF Stats – June 2009, $1.5 Trillion Traded
The number of US-listed exchange traded products increased by 13 in June after dropping by 14 the prior month. The total value of shares traded was $1.5 trillion, just below May’s $1.505 trillion. June brought the introduction of 16 new products, consisting of 14 ETFs and two MacroShares. One…
 ETF Stats for May 2009
The month of May brought the largest monthly decline ever in the number of US-listed ETFs and ETNs. Active listings changed by -14 after averaging more than +17 new products per month during the past three calendar years. Additionally, the six-month moving average of net new listings turned negative…
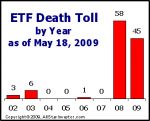 ETF Death Toll Climbs to 113
May 18 was the last trading day for 19 ETFs from PowerShares. If you did not sell your shares by the deadline, you now get to experience the ETF liquidation process first-hand. Final distribution amounts will be determined at today’s close. However, PowerShares stated on May 1 that the funds…
 ETF Stats – April 2009
The month of April brought seven new ETFs and one new ETN to market. Additionally, three ETNs left the scene while all ETFs remained active. With all changes netted out, there were a total of 844 (759 ETFs and 85 ETNs) exchange traded products listed at the end of April. This is a net increase of…
ETF Stats for March 2009
The month of March 2009 brought two new ETFs and no new ETNs. There were six ETF closures during the month as SPA closed all six of their ETFs and exited the business. They are the second ETF firm to close shop this year, following in the footsteps of Northern Trust and their NETS brand ETFs. With a…
 ETF Stats for February 2009
The month of February 2009 produced four new ETFs and no new ETNs. There were 17 closures during the month as Northern Trust closed and liquidated all of their NETS brand ETFs. With a net decrease of 13, the overall count of U.S. listed ETFs and ETNs dropped to 843 at the end of February, which is…
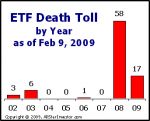 Lifetime ETF Death Toll Climbs to 85
Yesterday, February 9, was the last day of trading for the 17 NETS brand ETFs from Northern Trust. If you have not sold your shares by now, then you get to experience the liquidation process first hand. Northern Trust previously stated its intent to pay all remaining shareholders on February 20,…
 ETF Stats for January 2009
January 2009 brought nine new ETFs and two new ETNs. There were no closures during the month. However, Northern Trust announced plans to close all 17 of the NETS brand ETFs in February. With a net increase of 11, the overall count of U.S. listed ETFs and ETNs climbed to a new high of 856 at the end of…
Final ETF Death Toll for 2008 = 58
The ETF industry was 10 years old before it had its first casualty in 2003. A total of four funds closed that year, a group of bond ETFs known as FITRs. Three years passed before the next ETF fell by the wayside with the departure of the SPDR O-Strip in 2006. At the end of 2007, the U.S. ETF industry…